Note
Go to the end to download the full example code
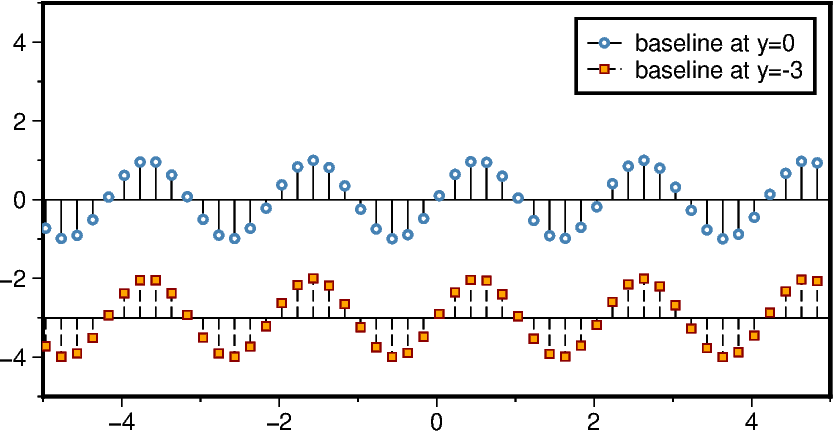
Stem plot
The pygmt.Figure class does not provide a built-in or high-level method
to create stem plots. But users can accomplish this in PyGMT via
adding NaN to separate the single records
using decorated lines (
"~") with"N+1"to get only a symbol at the end
The stem symbol (fill, outline) and stem line (color, thickness, style) as well as the
baseline (color, thickness, style) can be adjusted independently of each other using
the style, fill, and pen parameters of pygmt.Figure.plot. Here, a
basic example is provided showing how to prepare the data and plot it afterward.
For details on decorated lines please see the Decorated lines example.
import numpy as np
import pygmt


# -----------------------------------------------------------------------------
# Define function to make data usable for a stem plot in PyGMT
def make_stem_data_from_xy(x, y, base=0):
    """
    Parameters
    ----------
    x : numpy array
        x values.
    y : numpy array
        y values.
    base : float, optional
        Baseline of the baseline [Default is 0].

    Returns
    -------
    x_stem : numpy array
        x values usable for stemp plot in PyGMT.
    y_stem : numpy array
        y values usable for stemp plot in PyGMT.
    """
    x_stem = []
    y_stem = []
    for i_rec in range(len(x)):
        x_temp = x[i_rec]
        y_temp = y[i_rec]
        x_stem.append(x_temp)
        x_stem.append(x_temp)
        x_stem.append(np.nan)
        y_stem.append(0 + base)
        y_stem.append(y_temp + base)
        y_stem.append(np.nan)

    return (x_stem, y_stem)


# -----------------------------------------------------------------------------
# Define sample data
x = np.arange(-np.pi * 4, np.pi * 4, 0.2)
y = np.sin(x * 3)

# Create new Figure instance
fig = pygmt.Figure()

size = 5
fig.basemap(region=[-size, size, -size, size], projection="X10/5c", frame=True)

# -----------------------------------------------------------------------------
x_stem, y_stem = make_stem_data_from_xy(x, y)

# Draw base line
fig.plot(
    x=[x_stem[0], x_stem[-2]],
    y=np.array([0, 0]),
    pen="0.5p,black",
)

# Add stem plot
fig.plot(
    x=x_stem,
    y=y_stem,
    # Use circles with a diameter of 0.1 centimeters as stem symbol
    # Use white as fill and a 1-point thick, steelblue pen for the outline
    style="~N+1:+sc0.1c+gwhite+p1p,steelblue",
    # Use a 0.5-points thick, black, solid line as stem line
    pen="0.5p,black,solid",
    label="baseline at y=0",
)

# -----------------------------------------------------------------------------
base = -3
x_stem, y_stem = make_stem_data_from_xy(x, y, base=base)

fig.plot(
    x=[x_stem[0], x_stem[-2]],
    y=np.array([0, 0]) + base,
    pen="0.5p,black",
)

fig.plot(
    x=x_stem,
    y=y_stem,
    # Use squares with a size of 0.15 centimeters as stem symbol
    # Use orange as fill and a 0.5-points thick, darkred pen for the outline
    style="~N+1:+ss0.15c+gorange+p0.5p,darkred",
    # Use a 0.5-points thick, black, dashed line as stem line
    pen="0.5p,black,dashed",
    label="baseline at y=-3",
)

# -----------------------------------------------------------------------------
fig.legend()
fig.show()
Total running time of the script: (0 minutes 1.004 seconds)